When you’re trying to grow a business, there’s no shortage of numbers you could keep an eye on. But not all data is helpful. In fact, focusing on the wrong numbers can slow you down.
The real game-changer is knowing which metrics actually drive growth. If you want to make better decisions without drowning in reports, here are the five metrics every business should track to stay focused and move forward.
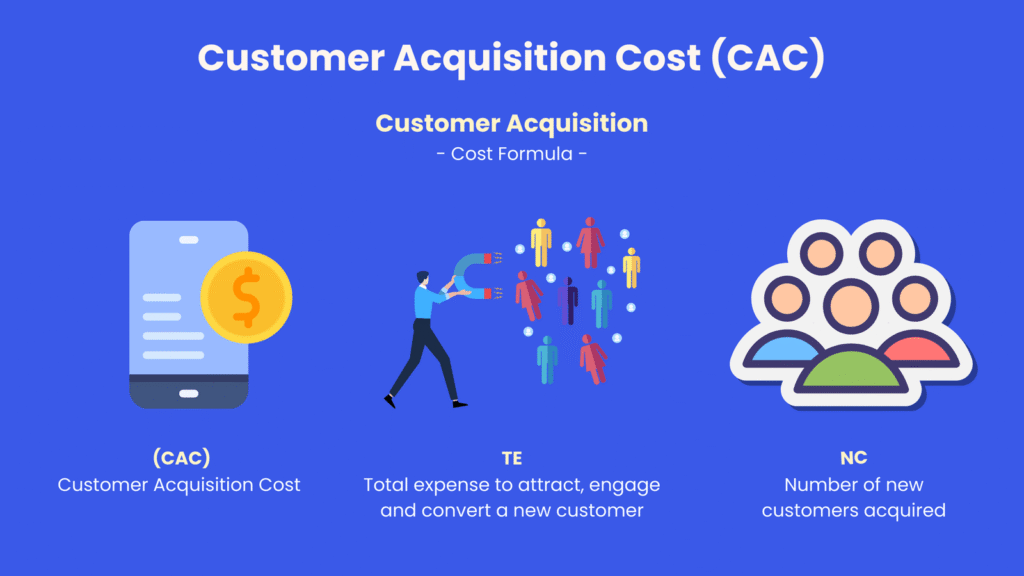
1. Customer Acquisition Cost (CAC)
This is the big one. You need to know exactly how much it costs to bring in a new customer. CAC shows how much you’re spending on marketing and sales to turn a lead into a paying customer.
Why Does It Matters?
If you’re spending more to acquire a customer than they’re worth, you’re losing money. A high CAC means your marketing is inefficient. A low CAC means things are working well.
How to Calculate It?
📊 CAC = Total Sales and Marketing Spend ÷ Number of New Customers
What to Watch For?
If your CAC is too high, look at your marketing and sales process. Are your ads reaching the right people? Is your funnel converting smoothly? The goal is to bring in customers without burning through your budget.
👉 Example: You spend $5,000 on marketing in a month and get 50 new customers. Your CAC is $100. But if each customer only brings in $80, you’re in the red. Time to optimize.
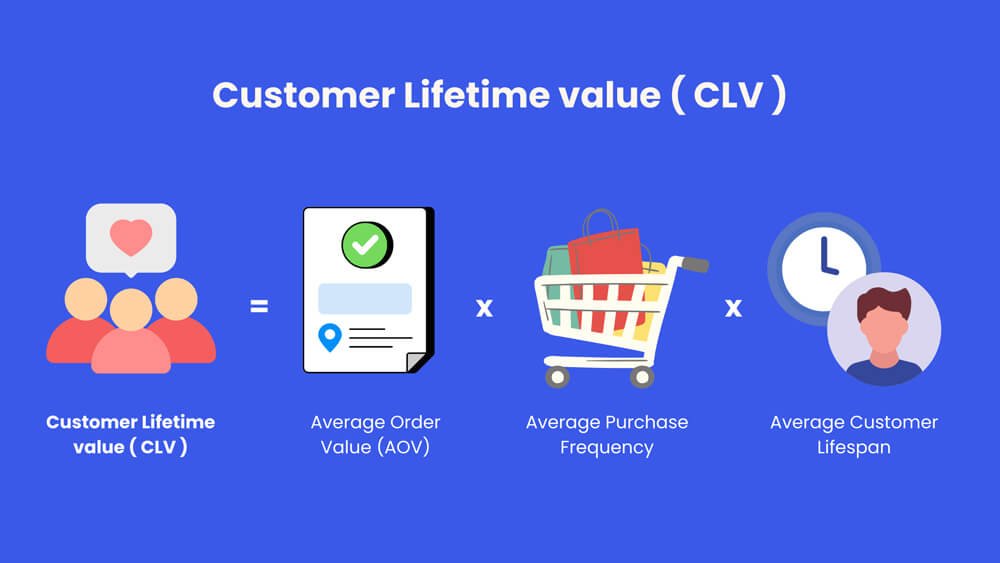
2. Customer Lifetime Value (CLV)
If CAC tells you what it costs to get a customer, CLV tells you how much that customer is worth over time.
Why Does It Matters?
A single sale is nice, but long-term relationships are where real growth happens. A high CLV means customers stick around, keep buying, and stay connected with your brand. The more loyal they are, the more valuable they become.
How to Calculate It?
📊 CLV = (Average Purchase Value × Purchase Frequency) × Customer Lifespan
What to Watch For?
The goal is to grow CLV by keeping customers engaged. Focus on solid customer service, loyalty programs, and smart upsells. When your CLV is strong, you can afford to spend more on acquiring new customers because you know the return will be worth it.
👉 Example: If a gym member pays $50 per month and stays for 24 months, their CLV is $1,200. If your CAC is $100, that’s a solid return.
📖 Want to keep customers engaged? Check out our 4A Content Framework. It shows how the right content at each stage of the customer journey can build trust and increase retention.
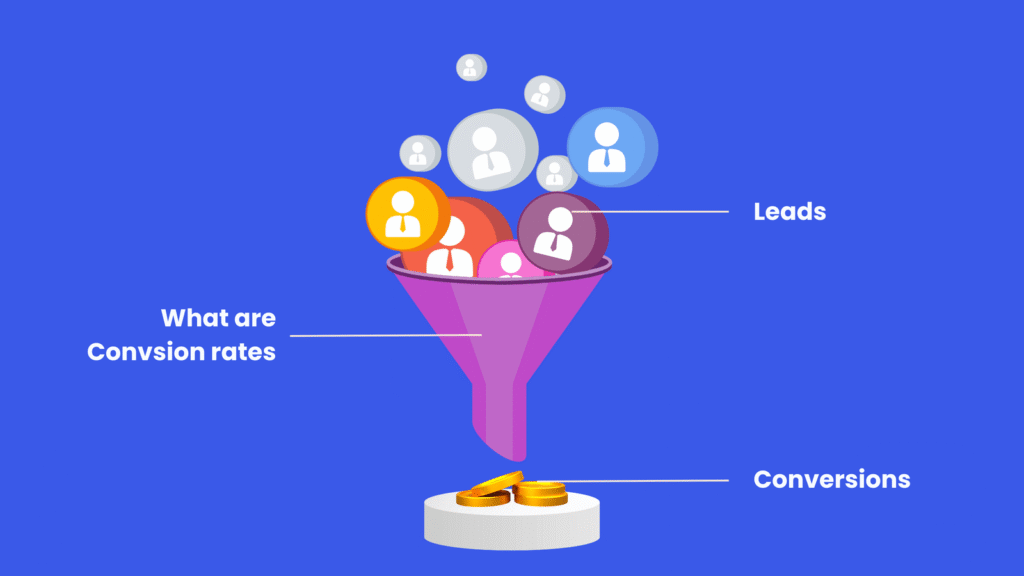
3. Conversion Rate
Conversion rate shows how many people take action after visiting your site. That action could be signing up, booking a demo, or making a purchase. It tells you how well your website and marketing are turning visitors into customers.
Why Does It Matters?
A high conversion rate means your site is doing its job. A low one means something is off. Maybe your call-to-action isn’t clear, the site is slow, or the checkout process is too complicated.
How to Calculate It?
📊 Conversion Rate = (Conversions ÷ Total Visitors) × 100
What to Watch For?
If people are visiting but not converting, figure out what’s blocking them. Is your messaging clear? Is the site easy to use? Small changes like improving your CTA or speeding up the page can make a big impact.
👉 Example: If 10,000 people visit your store and 200 buy something, your conversion rate is 2%. Fixing things like slow pages or confusing navigation could turn more visitors into buyers.
💡 Not sure why people aren’t converting? Our Website Audit Service finds what’s slowing you down and shows you how to fix it. From slow load times to weak CTAs, we’ll help you get better results.
4. Churn Rate
Churn Rate tracks how many customers stop using your product or service over a certain period. It’s one of the most overlooked but important metrics for any business.
Why Does It Matters?
Getting new customers is great, but if you’re losing them just as fast, you’re not growing. Since it costs less to keep customers than to find new ones, reducing churn is a major part of long-term success.
How to Calculate It?
📊 Churn Rate = (Number of Customers Lost ÷ Total Customers at Start of the Period) × 100
If your churn rate is high, ask yourself:
❌ Are customers getting the value they expected?
❌ Are there customer service issues?
❌ Are they leaving for a competitor?
👉 Example: If you start the month with 1,000 customers and lose 50, your churn rate is 5%. Understanding why people leave helps you create better retention strategies.
5. Net Promoter Score (NPS)
NPS is a simple but powerful way to measure customer satisfaction and loyalty. It’s based on one key question:
“How likely are you to recommend our business to a friend or colleague?”
Customers respond on a scale from 0 to 10 and fall into three groups:
🔵 Promoters (9-10): Loyal fans who love your brand.
🟡 Passives (7-8): Neutral customers who aren’t actively promoting you.
🔴 Detractors (0-6): Unhappy customers who might harm your reputation.
Why Does It Matters?
NPS gives you real insight into how your customers feel. A high score means your customers are happy and loyal. A low score means there’s work to do.
How to Calculate It?
📊 NPS = Percentage of Promoters – Percentage of Detractors
What to Watch For?
A strong NPS shows you have a solid base of satisfied customers who are likely to refer others. If your score is low, start collecting honest feedback and look for patterns to improve the experience.
👉 Example: If 50 percent of your customers are promoters and 10 percent are detractors, your NPS is +40. That’s a healthy sign. If the number goes negative, it’s time to dig into what’s going wrong.
Final Thoughts
Focusing on the right metrics can make all the difference in growing your business. Instead of getting lost in numbers that don’t move the needle, tracking CAC, CLV, Conversion Rate, Churn Rate, and NPS gives you a clear view of what’s working and what needs fixing.
Need help making sense of your data? Our sister website, Analyze Right, specializes in data analytics solutions that turn numbers into real insights. From setting up dashboards to spotting trends, we help you use data to make smarter business decisions.